Reports and Dashboard
Use Auditing & Reports for filtered sales lists and CSV export (Admin and Accounts). Use Dashboard for live KPIs and charts (Admin only).
Who and where
| Screen | Roles | Route | Nav / title |
|---|---|---|---|
| Reports | Admin, Accounts | /reports | Reports / header Auditing & Reports |
| Dashboard | Admin | /dashboard | Dashboard |
Accounts land on /reports after login. Stock / Design / Print do not use these screens.
Reports (sales list + CSV)
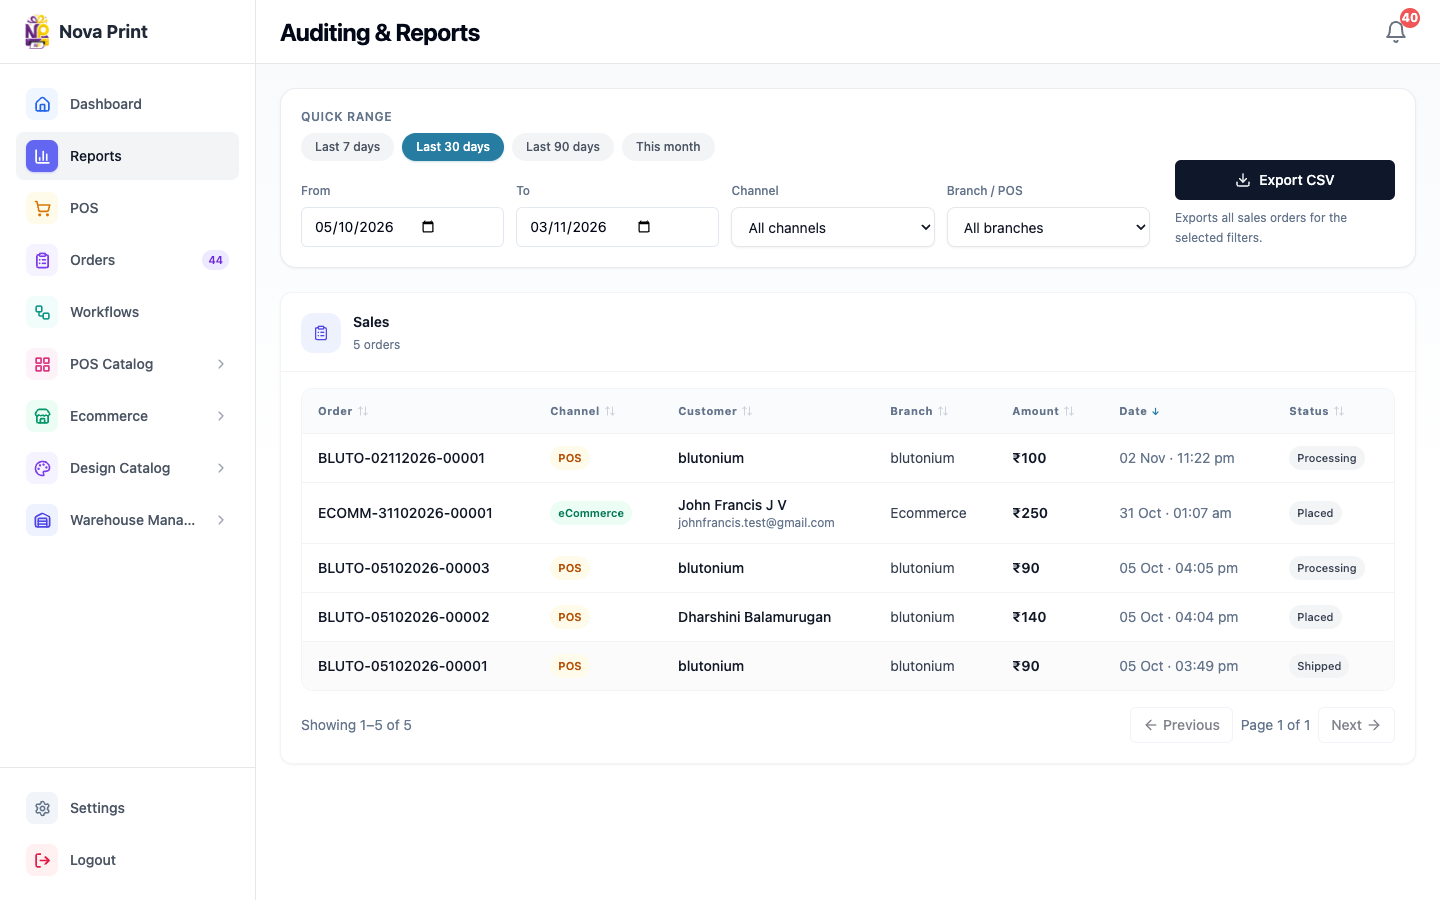
The live Reports page is filters + Sales table + Export CSV. Summary cards and trend charts exist in the codebase but are not mounted on this page — do not expect them in the current UI.
1. Open Reports
- Sign in as Admin or Accounts.
- Open sidebar Reports.
- Confirm header Auditing & Reports.
2. Set filters
- Under Quick range, pick Last 7 days, Last 30 days (default), Last 90 days, or This month.
- Or set From / To dates.
- Set Channel: All channels, POS only, or eCommerce only.
- Set Branch / POS: All branches or a named terminal (list narrows with channel).
Helper on export: Exports all sales orders for the selected filters.
3. Read the Sales table
- Section Sales shows
{N} order(s). - Sortable columns: Order, Channel, Customer, Branch, Amount, Date, Status.
- Channel badges appear as POS / ECommerce from the data.
- Paginate with Previous / Next and Page X of Y (Showing X–Y of Z).
- Empty: No sales — Adjust the date range or filters to see orders.
4. Export CSV
- Click Export CSV.
- Success: Export ready — file name pattern
sales-report_{startDate}_{endDate}.csv. - Failure: Export failed.
Dashboard (admin analytics)
5. Open Dashboard
- Sign in as Admin.
- Open Dashboard (
/dashboard). - Greeting:
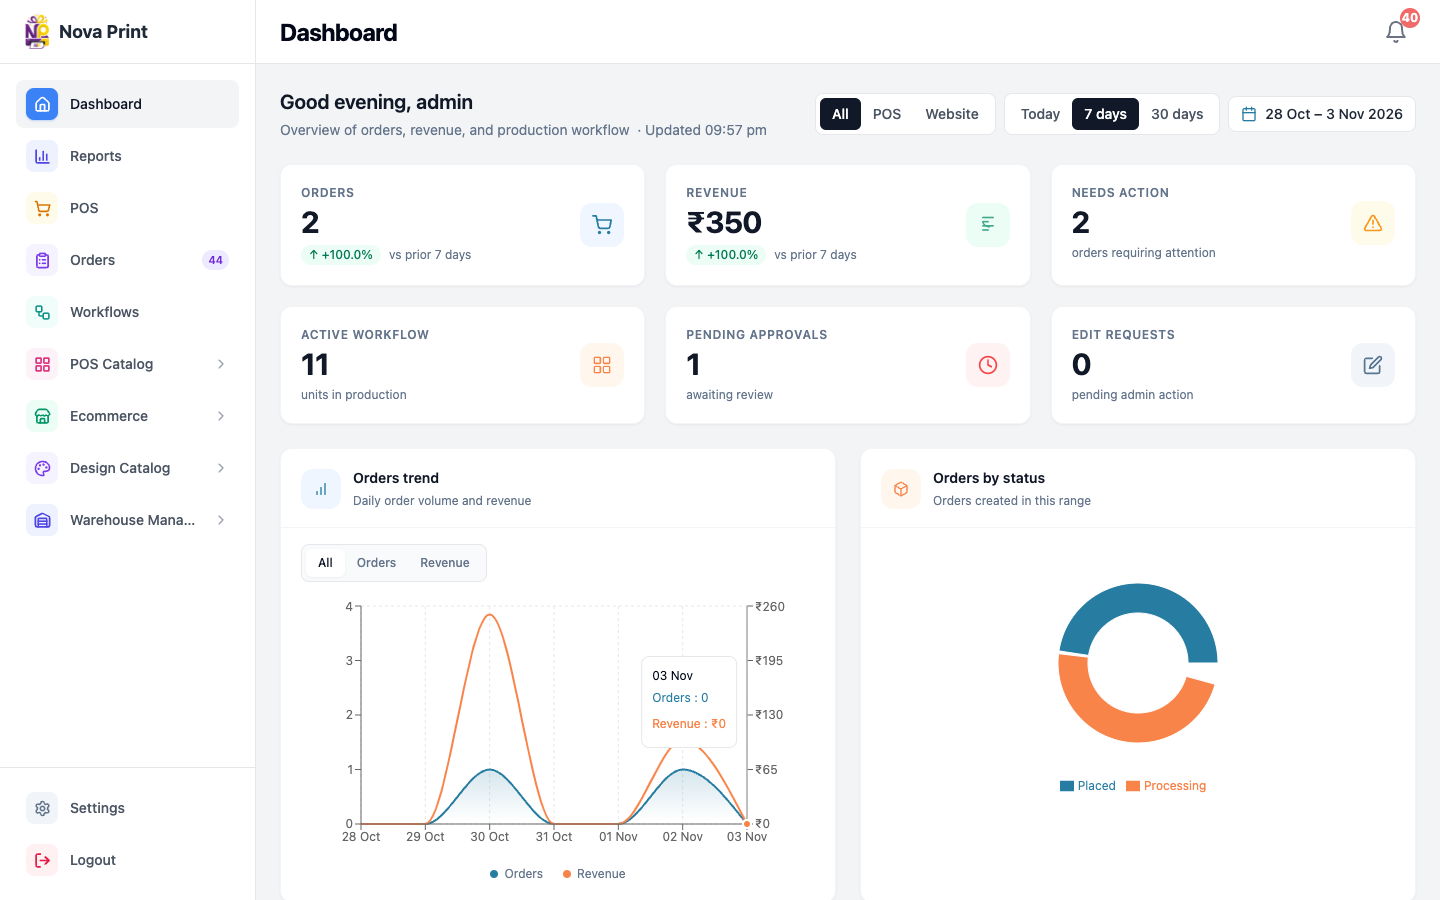
{Good morning/afternoon/evening}, {username}with overview copy such as Overview of orders, revenue, and production workflow.
6. Filter channel and dates
- Channel tabs: All, POS, Website.
- Date presets: Today, 7 days, 30 days, or calendar Select dates.
- Watch Updated {time} (and refreshing… while fetching).
7. Read KPIs
| KPI | Subtitle / notes | Click goes to |
|---|---|---|
| Orders | Comparison vs prior period | /orders |
| Revenue | Comparison vs prior period | — |
| Needs action | orders requiring attention | /orders |
| Active workflow | units in production | /workflows |
| Pending approvals | awaiting review | /workflows |
| Edit requests | pending admin action | /orders |
8. Charts and lists
- Orders trend — tabs All, Orders, Revenue.
- Orders by status.
- Workflow pipeline.
- Revenue by POS (or website-oriented title when channel is Website).
- Recent orders — View all orders; open a row for detail.
- Urgent workflow — Approvals and failed units; Open board.
- Recent activity — notification feed; View all →
/notifications.
Checklist
- Accounts use Reports for sales audit; they cannot open Dashboard stats.
- Export CSV uses the same filters as the on-screen table.
- Dashboard KPIs match the selected channel and date range before acting.
- Urgent workflow / needs-action counts followed up on Orders or Workflows.